
Best answer Capacity should set sprint scope; velocity should sanity-check it. Capacity is the story-point budget for this sprint given who is available and how much effective time they have. Velocity is historical output, story points completed in past sprints.
If your average velocity is 36 SP but two developers are on leave and 9 SP of carry-over remains, planning another 36 SP of new work is not realistic. Capacity tells you the current budget; velocity only tells you what happened before.
Two numbers, two directions
Velocity and capacity both use story points, but they point in opposite directions:
| Measure | Direction | Question it answers | Typical source |
|---|---|---|---|
| Velocity | Backward | What did we complete in recent sprints? | Jira velocity chart, closed-sprint reports |
| Capacity | Forward | What can we take on this sprint? | Throughput history, person-days, efficiency %, time off, carry-over load |
Treating last sprint’s velocity as this sprint’s scope ignores the main variable that changes every iteration: availability. That is why teams with stable velocity still miss forecasts when holidays, onboarding, or support load shift mid-quarter.
What velocity measures in Jira sprints
In Jira Software Cloud, the velocity chart shows completed estimates per sprint, usually story points on issues that reached Done by sprint end. The black average line is the mean across the sprints displayed.
Important constraints from how Jira builds the chart:
- Board-specific. Only issues on that board’s filter count. Another team’s velocity is not yours.
- Column mapping matters. “Done” means the right-most mapped column, not a label you use informally.
- Commitment vs. completed differ. The gray commitment bar is scope at sprint start. The green completed bar is what finished, including scope added after the sprint started. Comparing them shows forecast error, not just speed.
- More sprints, steadier average. Atlassian notes velocity becomes more useful as history grows; one or two sprints are a weak basis for a hard target.
Velocity answers “what happened?” It does not know that two developers are on leave this sprint or that a release will consume three days.
What capacity measures in Jira sprints
Capacity is a forward budget: how many story points of remaining work the team can absorb this sprint given real availability. In ScrumNav it is estimated from historical throughput adjusted by this sprint’s person-days, efficiency, and time off. Inputs include:
- Who is on the team for this sprint
- Available person-days per person (defaults and sprint-specific adjustments)
- Efficiency, the share of time available for delivery work after meetings and support
- Shared time off (holidays, team events)
- Carry-over load counted at remaining points, not always full estimate
Jira tracks story points on issues and sprint scope, but it does not model team availability or a live load-vs-capacity budget during planning. Teams either approximate capacity in spreadsheets or use a capacity model alongside Jira. See the sprint capacity guide for how ScrumNav approaches this.
Velocity vs capacity: which sets sprint scope?
Capacity should set sprint scope; velocity should sanity-check it. The scope the team agrees to deliver should match this sprint’s capacity, not last sprint’s velocity copied forward.
When your capacity model converts availability into story points, compare the result to average completed points from recent closed sprints. If capacity implies 45 points but the team has not exceeded 32 in the last four sprints with similar availability, resolve the gap before committing, wrong estimates, unmodeled carry-over, or optimistic availability are the usual causes.
Incomplete issues: velocity ignores them; capacity cannot
Velocity only counts issues that reached Done by sprint end. Tickets still in progress do not appear in the completed bar, but they still consume effort in the next sprint.
Capacity and planned load must count remaining work on carry-over, not always the full story point estimate. After sprints close, a sprint rollover report in Jira shows how much of each sprint was rolled work versus new scope. A 13-point issue that is 70% complete should add roughly 4 points of load, not 13. If you plan from velocity alone, you treat that ticket as “free” until someone remembers mid-sprint.
Example: average velocity is 36 SP. Three in-progress issues carry over with 9 SP of remaining work combined. Capacity for the new sprint is still ~36 SP, but 9 SP is already spoken for, room for new backlog items is closer to 27 SP before buffer. Velocity says nothing about that gap; capacity and planned load must.
Model completion in the capacity settings (status- or time-based). For remaining load, completion %, and the planning workflow, see how to handle sprint carry-over in Jira.
Worked example: same velocity, different capacity
A six-person team completed an average of 36 story points over the last three closed sprints. Sprint length is two weeks; default capacity assumed everyone at full availability.
Next sprint: two members are on holiday for three working days each (six person-days lost out of ~60). No new hires; estimation scale unchanged.
- Velocity-only planning commits ~36 points because “that is what we usually do.”
- Capacity-based planning reduces effective person-days by ~10%, yielding a budget near 32 points before buffer.
If the team still plans 36, the over-commit is structural, not a motivation problem. The fix is replanning scope to the lower budget, not pushing harder mid-sprint.
Where velocity shows up in Jira (and ScrumNav reports)
Jira does not label a single “velocity” field during planning. You read it from history:
- Jira velocity chart (board Reports), completed story points per sprint and an average line across recent sprints.
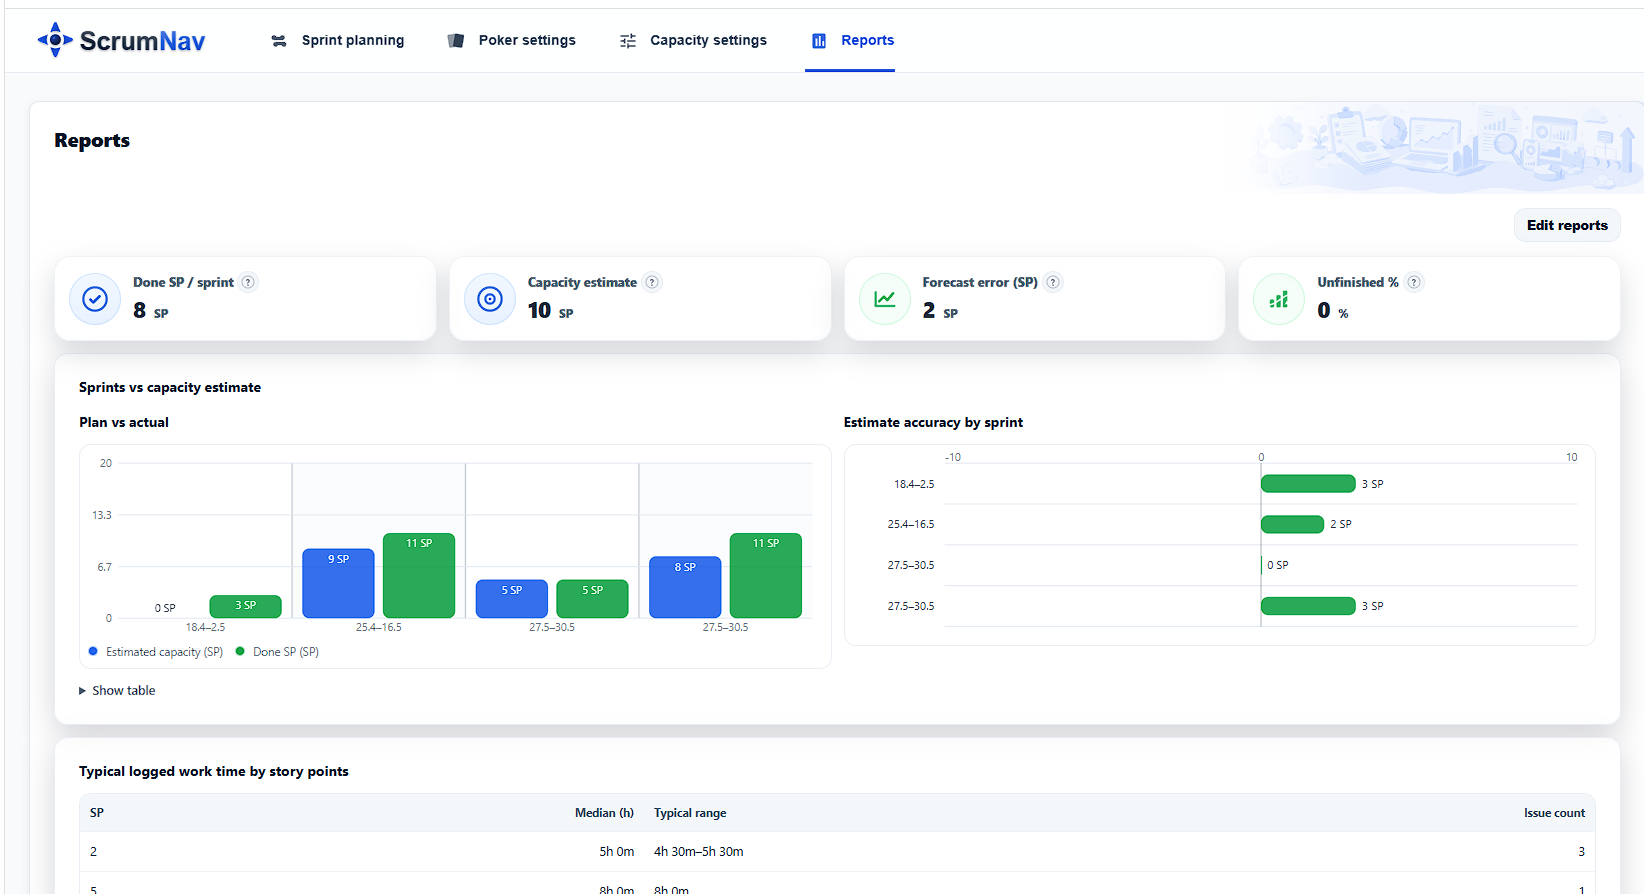
- ScrumNav sprint reports: the Done SP / sprint KPI is average completed points (velocity). The Plan vs actual chart shows done SP per closed sprint. Capacity estimate is separate: velocity scaled by this sprint’s working time, your forward budget, not the historical average itself.
See the sprint reports guide for how teams use done SP and forecast error before the next sprint planning session.
When velocity misleads
Do not use average velocity alone to set sprint scope when:
- Availability changed. Leave, part-time members, or on-call rotation reduced effective days.
- The team changed. New members, departures, or contractors alter throughput before history reflects it.
- Recent sprints were outliers. One release-heavy or incident-heavy sprint skews a small window.
- Carry-over was high. Completed points looked fine while unfinished work piled up, velocity masked load.
- Estimation scale shifted. Re-baselining story points breaks comparison with older sprints.
In those cases, capacity from current availability should override velocity. Use sprint reports to see plan vs. actual and whether past “velocity” was sustainable.
When velocity is a fair sanity check
Velocity aligns with capacity when the team is stable, estimation is consistent, and recent sprints had normal availability. Then average completed points should sit close to what your capacity model predicts. Large gaps in either direction signal a model to fix:
- Capacity >> velocity: scope may be too ambitious, or estimates too small.
- Velocity >> capacity: capacity model may undercount availability, or the team is completing work not captured in planned load.
Three checks before you lock scope
Before the Product Owner and team agree on sprint scope in Jira sprint planning:
- Capacity number for this sprint: from person-days, efficiency, and time off (capacity settings).
- Velocity trend: average done SP over enough closed sprints to smooth noise (often three to six); check the sprint reports Done SP / sprint KPI or Jira’s velocity chart.
- Last sprint forecast error: planned scope vs. completed; carried-over load counts against this sprint’s budget.
If all three agree within a reasonable band, sprint scope is well grounded. If they diverge, resolve the gap before adding issues, not after the sprint starts.
For the full planning workflow (estimates, carry-over, buffer), see how to plan a realistic Scrum sprint.
Frequently asked questions
- What is the difference between capacity and velocity?
- Capacity is a forward-looking estimate of how much work the team can take on this sprint based on availability. Velocity is a backward-looking measure of completed story points in past sprints. Capacity should set sprint scope; velocity should sanity-check it.
- Should sprint scope equal average velocity?
- No. Average velocity describes past delivery. Sprint scope should reflect this sprint’s actual capacity, available time adjusted for absences, efficiency, carry-over, and focus. Use velocity to sanity-check capacity, not as the budget by itself.
- Can sprint capacity be higher than recent velocity?
- Yes. Capacity can be higher than recent velocity if the team has more available person-days than in recent sprints, or if recent velocity was reduced by one-off events such as leave, incidents, or interruptions. Before planning above trend, check that estimates, team composition, and work type are comparable.
- How many sprints do you need for a useful velocity average?
- Velocity becomes more useful as history grows. Many teams use three to six recent closed sprints as a practical range. Fewer sprints can work if throughput is stable, but sprints with major roster changes, process changes, or unusual disruptions should be excluded or annotated.
- Does Jira velocity count unfinished issues?
- No. Jira velocity is based on work completed by the end of the sprint. Only issues that reached Done, according to the board’s column mapping, count as completed. Unfinished issues are not counted as completed velocity. Work added after the sprint starts can affect completed totals, but it does not change the original sprint scope.
- Where do I see velocity in Jira?
- In Jira Software Cloud, open Reports on your Scrum board and view the Velocity Chart. It shows completed story points per sprint and helps teams compare planned work with delivered work. In ScrumNav sprint reports, velocity appears as Done SP per sprint and as an average across recent sprints. Capacity estimate is shown separately as the forward-looking planning number for the next sprint.
- Do in-progress issues affect velocity or capacity?
- They do not add to velocity. Only Done work counts. They do affect capacity and planned load: carry-over should use remaining story points (estimate × (1 − completion %)), not always the full estimate. See how to handle sprint carry-over for the full workflow. That is why strong velocity can still leave little room for new scope.
Want to see this workflow in practice? Try the ScrumNav interactive demo with sample Jira data.