
Best answer The best way to report carry-over stories in Jira is to compare consecutive closed sprints, identify issues that were incomplete at the previous sprint close and still in scope in the next sprint, then calculate their story points as a share of total sprint scope. ScrumNav automates this as a Jira carry over stories report with average rollover %, a new vs rolling story points report, and rolled-in issue lists per sprint.
Sprint rollover vs carry-over vs spillover in Jira
Teams use different names for the same idea. In Jira sprint reporting, these terms usually mean the same thing:
| Term | What it means |
|---|---|
| Sprint rollover | Unfinished work from a closed sprint that remains in the next sprint’s scope |
| Carry-over / carryover | Same as rollover; common in sprint planning and retro discussions |
| Spillover | Same metric, often used when describing work that “spilled” past the sprint boundary |
| Leftover stories | Issues not Done at sprint close that roll forward |
Whatever label your team uses, the report should answer the same questions: how much work rolled forward, what share of each sprint it was, and which issues caused it.
What is sprint rollover in Jira?
Sprint rollover is work that was in a sprint’s scope when the sprint closed but did not reach Done, and then appears in the next sprint’s scope. Some carry-over is common in Scrum teams, but when rollover is high sprint after sprint, it signals planning, WIP, or estimation problems rather than a one-off slip.
Rather than only listing incomplete tickets, look for a view that measures how much of each closed sprint was rollover work by story points, tracks the trend across recent sprints, and names the specific issues that kept rolling, including how many closed sprints in the report window each ticket appeared in scope.
Does Jira have a carry over stories report?
Jira Software Cloud has a sprint report for each individual sprint, showing completed and incomplete issues at sprint close. However, Jira’s built-in sprint report and velocity chart do not present this as a single multi-sprint carry-over stories report with average rollover %, new vs carried-over story points, and rolled issue lists.
Teams often fill the gap with exports, JQL workarounds, spreadsheets, or apps from the Atlassian Marketplace. For retros and planning you need trend data across closed sprints, not just one sprint snapshot.
Does Jira have a native sprint rollover chart?
In Jira Software Cloud’s built-in reports, there is no dedicated sprint rollover chart equivalent to this multi-sprint carry-over view. Jira offers adjacent views, but they do not calculate rollover across consecutive closed sprints in one report.
Limitations of native Jira reports for carry-over:
- The sprint report shows completed vs incomplete issues for one sprint — no cumulative rollover trend or average rollover %.
- The velocity chart compares committed vs completed story points over time, but does not identify which issues rolled from sprint to sprint or split scope into new vs carried-over work.
- Neither view provides a rolled issue list with source sprint and rollover % per closed sprint across a sprint history window in one place.
That gap is why teams add marketplace reports or build spreadsheet exports. ScrumNav puts the report next to sprint planning and capacity settings on the same board, so measurement feeds directly into the next planning session.
Sprint rollover vs Jira velocity chart
The velocity chart and a sprint rollover report answer different questions. Confusing them is a common reason teams misread sprint health.
| Report | Measures | Good for |
|---|---|---|
| Velocity chart | Story points completed (Done) per sprint | Backward delivery trend, sanity-checking capacity |
| Sprint rollover report | Story points that rolled in from the previous sprint | Planning accuracy, spillover trends, retro evidence |
A team can show healthy velocity while still carrying heavy rollover: Done work looks fine, but much of the sprint scope was leftover stories, not new commitment. Use velocity to sanity-check output; use rollover reporting to see how much scope was unfinished work rolling forward. See velocity vs capacity in Jira for how both fit planning.
Why measure carry-over across sprints in Jira
Teams feel carry-over every sprint, unfinished tickets in Review, scope that “almost fit,” velocity that looks low while the board still feels full. One closed sprint in Jira’s sprint report shows incomplete work for that sprint. It does not answer whether rollover is getting better or worse over time, or how much of each sprint was rolled work versus new commitment.
Tracking rollover across several closed sprints helps Scrum Masters and teams:
- Spot sprints where most scope was rolled work, not new commitment
- Separate “we planned too much” from “we keep starting fresh work while old work lingers”
- Bring facts to retros instead of debating memory
- Explain low velocity when capacity went to finishing leftover stories
- Set stakeholder expectations with transparent rollover ratios, not anecdotes
- Pair with Jira sprint reports and sprint history to see the full picture
This is different from how to handle carry-over at planning, which covers remaining load and completion %. This article is about measuring rollover after sprints close.
What a Jira carry over stories report shows
In ScrumNav, enable Carry-over stories under Reports (when enabled in preferences). The view is built from closed sprint history on your board:
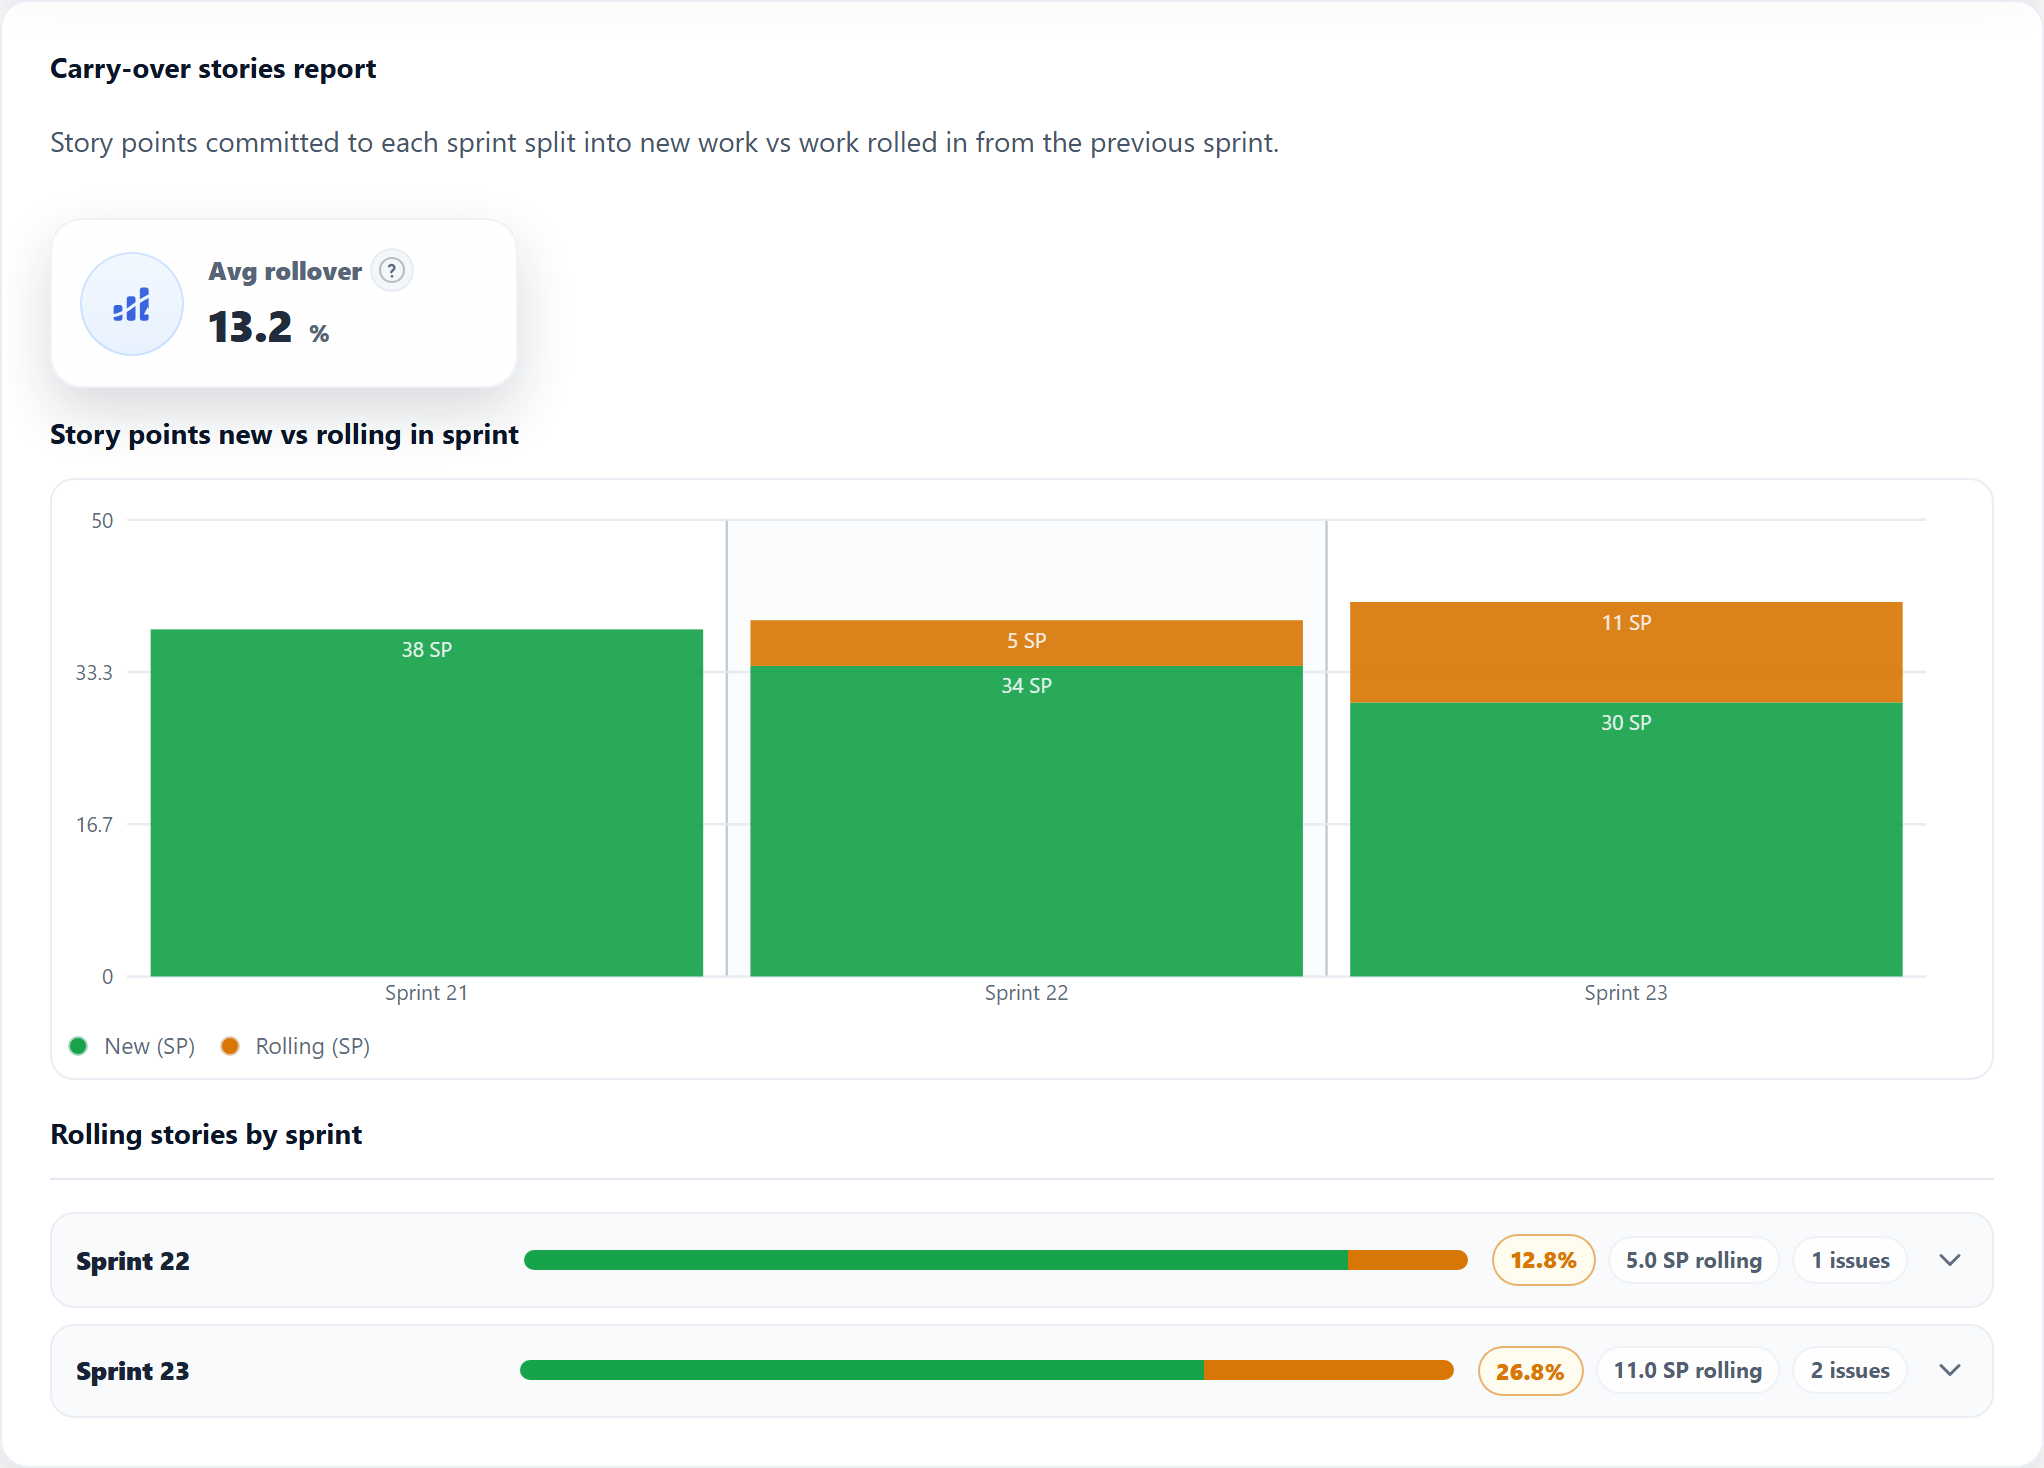
- Average rollover % across your configured closed-sprint window, a single KPI for “how much of recent sprints was rolled-in work by story points”
- Stacked chart: per closed sprint, story points split into New (committed fresh in that sprint) and Rolling (carried in from the previous sprint)
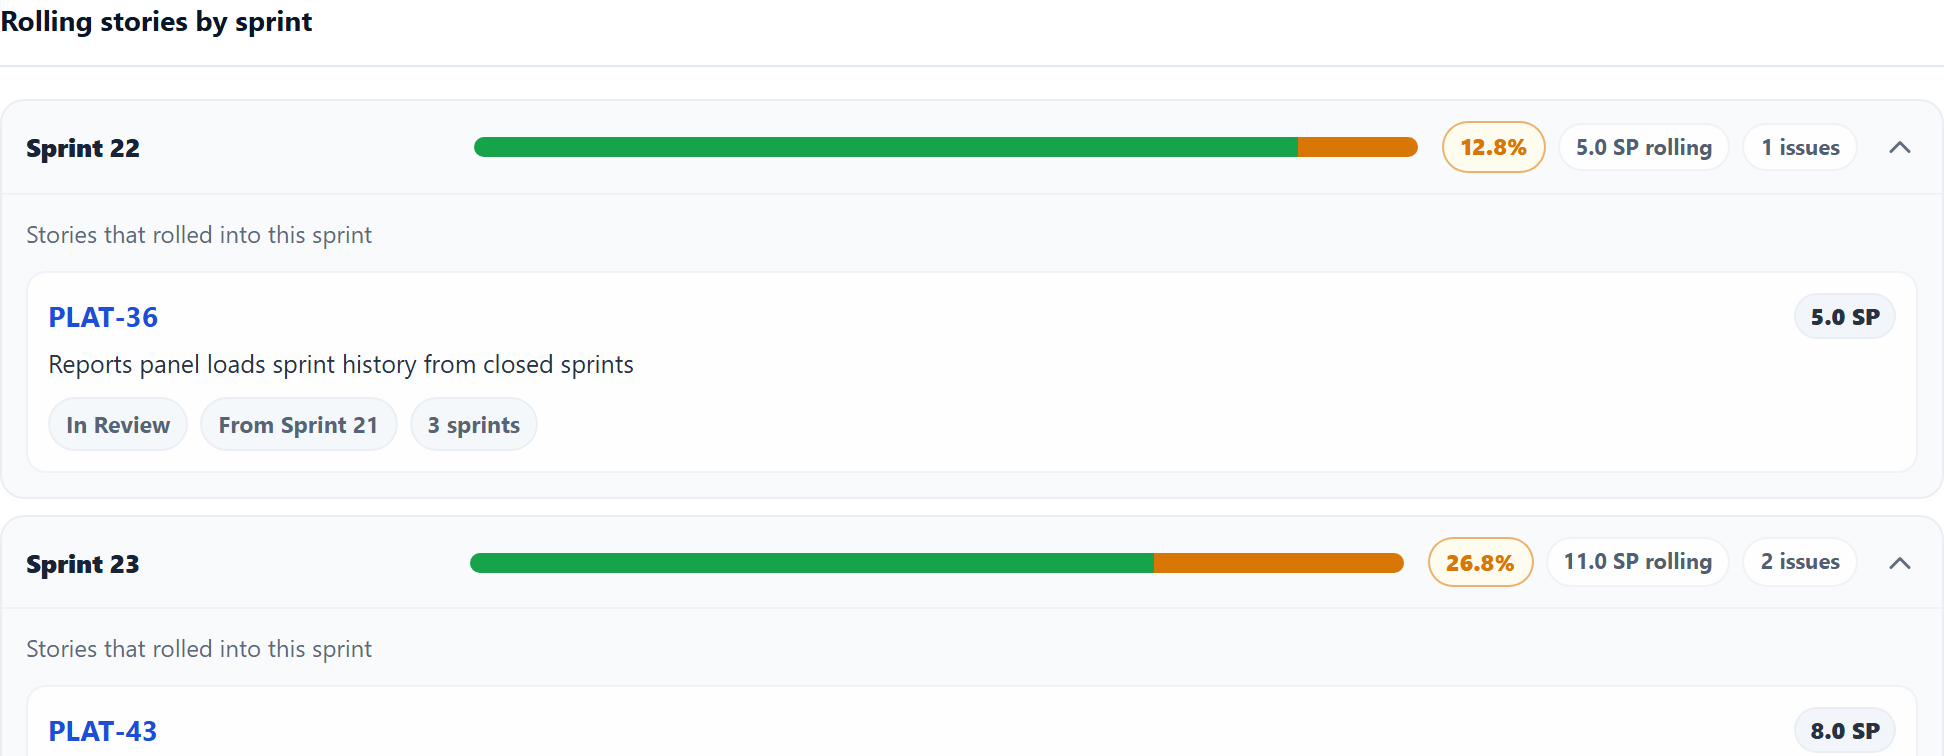
- Rolling stories by sprint: expandable rows listing rolled-in issues with story points, status, source sprint (the immediately previous closed sprint), sprint count within the report history window, and links back to Jira
Data comes from closed sprints on your Jira board, aligned with the same story point field you use in sprint capacity settings.
Who uses a sprint rollover report in Jira
Different roles use the same rollover data for different decisions:
- Scrum Masters — open the report before retro to highlight rollover %, name chronic spillover tickets, and discuss WIP or Definition of Done gaps with issue-level evidence.
- Developers & product owners — see which stories rolled and from which source sprint, so planning conversations start from facts instead of memory.
- Engineering managers & RTEs — compare rollover trends across recent closed sprints on a board to judge whether commitments are realistic before the next plan.
- Agile coaches — use average rollover % and new vs carried-over splits to coach estimation, capacity modeling, and sustainable flow without relying on a single velocity number.
Because ScrumNav lives in the same Forge app as sprint planning, teams can move from rollover insight to capacity-adjusted planning without switching to a separate dashboard.
For Jira admins
Jira admins can use a carry-over stories report to give teams rollover visibility without custom exports, manual sprint comparisons, or fragile JQL workarounds. Because ScrumNav uses board sprint history and the configured story point field, teams do not need to maintain a separate spreadsheet report.
How to calculate sprint rollover percentage in Jira
To calculate rollover percentage, compare consecutive closed sprints. For each closed sprint, ScrumNav compares sprint-close snapshots:
Rollover % = carried-over story points ÷ total sprint scope story points × 100
- Scope in sprint N (ScrumNav): in ScrumNav’s calculation, issues that were part of that sprint when it closed (completed + not completed at sprint end).
- Rolled in from sprint N−1 (ScrumNav): issues that were not completed when the previous sprint closed and also appear in sprint N’s scope.
- Rollover % for that sprint = rolling story points ÷ total story points in scope × 100 (see formula above).
The headline average rollover % is the mean of per-sprint rollover percentages (for sprints that had story points in scope). A sprint with 0% rollover means all scoped work was new to that sprint; a high percentage means much of the commitment was unfinished work rolling forward.
| Sprint | Total SP in scope | Rolling SP | Rollover % |
|---|---|---|---|
| Sprint 12 | 38 | 8 | 21% |
| Sprint 13 | 42 | 14 | 33% |
| Average rollover (example) | 27% | ||
New vs rolling story points per sprint
Each closed sprint’s scope splits into two buckets:
- New = total story points minus rolling story points (work that was not rolled in from the immediately previous sprint)
- Rolling = story points on issues that carried in from the previous sprint
This mirrors how teams describe sprint commitment in retro: “We only took 20 points of new work; the rest was carry-over.” Seeing that split sprint by sprint is easier than opening each historical sprint report in Jira manually.
Rolled-in issues can appear in multiple sprints over time. The per-issue list shows how many closed sprints in your configured history window the ticket was in scope — useful for spotting chronic rollover within that window.
Can JQL show carry-over stories across sprints?
JQL can help find issues that were in specific sprints, for example with
sprint in closedSprints() or sprint name filters. But JQL does not easily calculate
rollover %, story point splits, and source-sprint comparisons across consecutive closed sprints.
To do that reliably, you need sprint-close history and issue membership across consecutive closed sprints, not just current sprint assignment. That is why teams searching for “Jira query carry over sprint to sprint” often end up in exports, spreadsheets, or a dedicated reporting app on the board.
Using the sprint rollover report in retro and planning
Practical ways teams use rollover reporting:
- Retro opener. If average rollover is above your team’s comfort band — for example, some teams start reviewing the pattern around 20–30% — ask what kept rolled work from finishing: blockers, WIP, unclear acceptance criteria, or over-commitment.
- Compare to velocity. Low Done SP plus high rollover often means capacity went to finishing old work, not new scope. See velocity vs capacity.
- Name chronic tickets. Expand rolling stories for a sprint; issues with a high sprint count in the report window deserve a deliberate decision: finish, split, or descope.
- Feed planning. Pair measurement with remaining-load modeling so the next sprint does not plan a full batch of new work on top of unmodeled rollover.
How to enable the carry-over report in ScrumNav
In ScrumNav for Jira Cloud:
- Open Reports for your board.
- Edit report preferences and enable Carry-over stories.
- Set previous sprint count in capacity settings if needed, the report uses the same history window as velocity and sprint history reports.
Try it with sample data in the Launch demo (Reports section, carry-over card). For your Jira board, install ScrumNav from the Atlassian Marketplace.
Frequently asked questions
- What is sprint rollover in Jira?
- Unfinished work from a closed sprint that carries into the next sprint’s scope. Also called carry-over, spillover, or leftover stories. A sprint rollover report measures rollover % and lists which issues rolled.
- Is spillover the same as carry-over?
- Yes. Spillover, carry-over, rollover, and leftover stories describe the same concept in Jira sprint reporting — issues not Done at sprint close that remain in scope for the next sprint.
- Why is sprint rollover important?
- High rollover means much of a sprint was unfinished work rolling forward. Tracking rollover % across sprints improves planning accuracy, explains low velocity, and gives retrospectives transparent data instead of assumptions.
- Does Jira have a native sprint rollover chart?
- In Jira Software Cloud’s built-in reports, there is no dedicated sprint rollover chart equivalent to a multi-sprint carry-over view. The sprint report is per sprint; the velocity chart shows completed work, not which issues rolled between consecutive closed sprints or rollover % per sprint.
- What is a Jira carry over stories report?
- A multi-sprint report that identifies unfinished issues carried from one closed sprint into the next and calculates how much of each sprint’s story point scope was rolled-over work, usually with average rollover %, new vs carried-over story points, and rolled-in issue lists.
- Does Jira have a built-in carry over stories report?
- Jira’s sprint report covers one sprint at a time. The built-in sprint report and velocity chart do not present a single multi-sprint carry-over stories report with average rollover %, new vs carried-over story point splits, and rolled issue lists across consecutive closed sprints.
- How do you calculate rollover percentage in Jira sprints?
- Rollover % = carried-over story points ÷ total sprint scope story points × 100. In ScrumNav, count story points on issues incomplete when the previous sprint closed and still in the current sprint’s scope at close.
- How can I see stories carried over across multiple Jira sprints?
- Compare consecutive closed sprints and track issues that rolled forward with their story points. ScrumNav builds this view from your board’s closed sprint history with charts and per-sprint rolled-in issue lists.
- What is the best Jira report for carried-over stories?
- One that compares consecutive closed sprints, calculates rollover % by story points, splits each sprint into new vs carried-over work, and lists the issues that rolled forward. ScrumNav provides this as a carry-over stories report for Jira Cloud.
- What is the difference between velocity and carry-over?
- Velocity measures completed (Done) story points in past sprints. Carry-over measures unfinished work rolling into the next sprint’s scope. High rollover can explain low velocity without slower delivery on new work. See velocity vs capacity in Jira.
Explore carry-over rollover % and rolling issue lists in the interactive demo.